Respiratory CFD · Inhaled delivery

See where every breath lands.

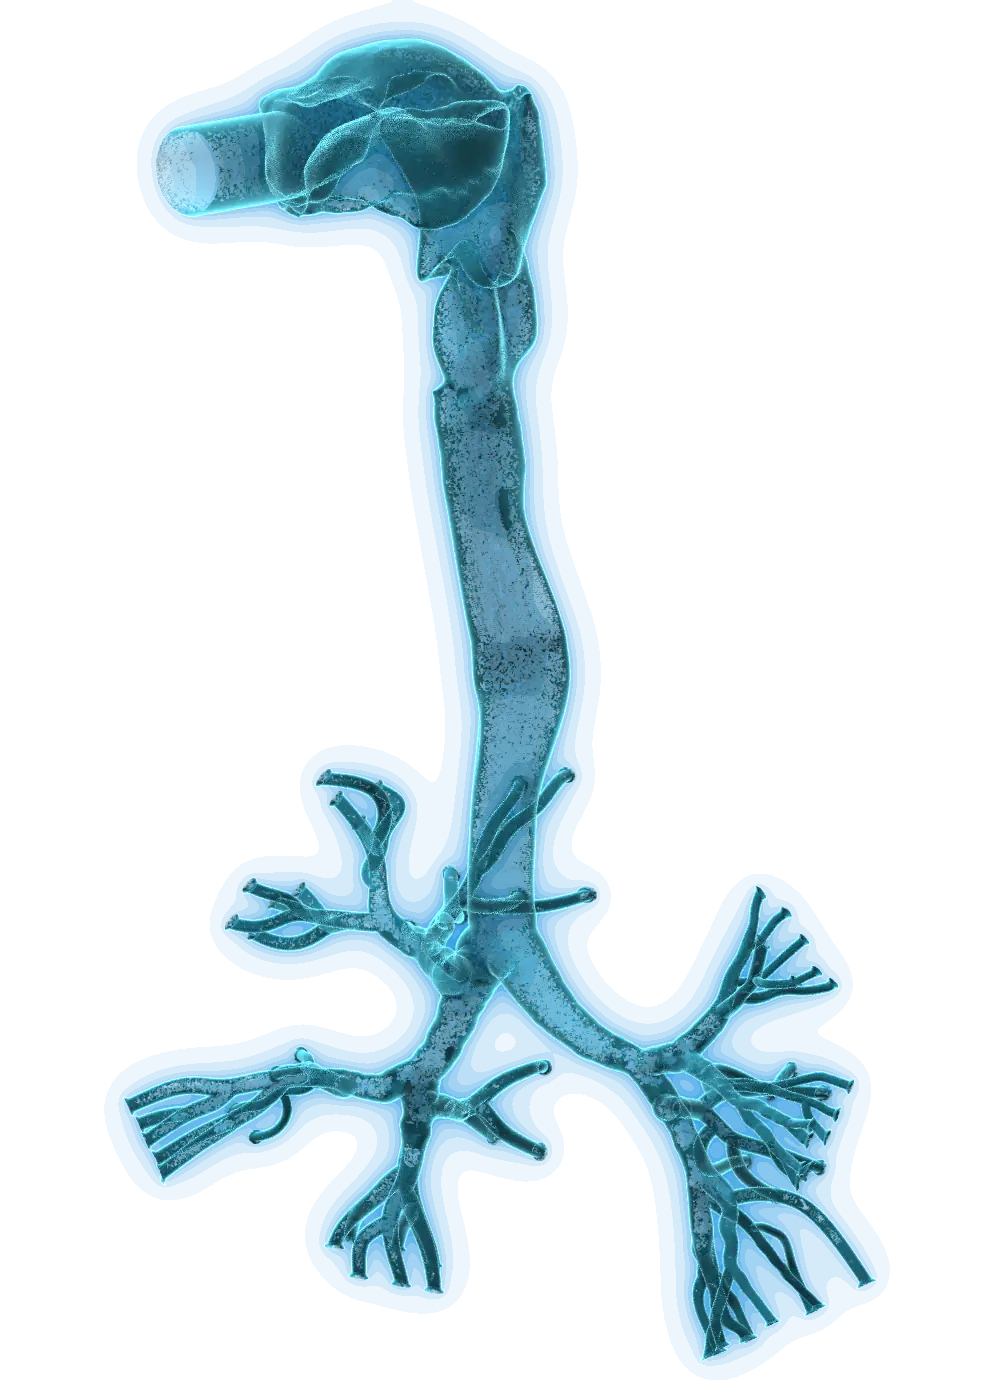
SomnetX simulates how an inhaled aerosol travels through the human airway and reports how much of each dose lands in every region, from the mouth–throat to the bronchi. Answers in days, before you commit to imaging or clinical studies.

60 L/min inhalation 0.5 mm lattice 22 airway segments GPU lattice Boltzmann LES
Glowing 3D model of a human airway from mouth and throat through the trachea into the bronchial tree mouthpiece trachea carina bronchial tree
SimInhale benchmark airway · particle paths illustrative
The gap

Your impactor measures particle size. Your patient needs to know where it lands.

Pharmacopeial tests push the aerosol through a right-angle metal throat at a constant flow. For many products they underpredict what the mouth and throat catch, and so overestimate the lung dose. We run the same aerosol through a human airway at the flow rates your patients actually reach.

What your cascade impactor reports ThroatS1S2S3S4S5S6S7MOC

Drug mass by particle size band. No anatomy, one fixed flow.

What SomnetX reports
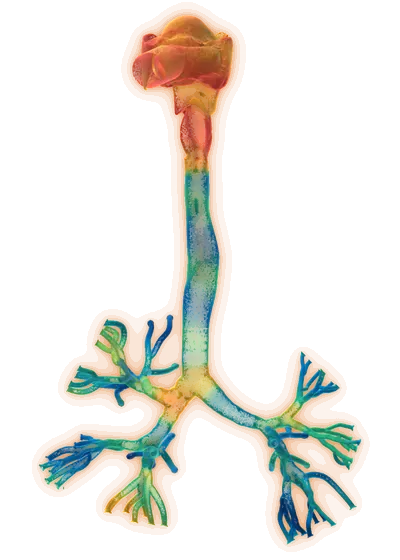
Airway model coloured by aerosol deposition, hot in the mouth and throat and at the main bifurcation
Mouth–throat
Trachea
Main bronchi
Smaller bronchi
Past the bronchi

Dose by airway region, for each flow rate and particle size you test.

Both panels are illustrative layouts, not measured values.

Where it pays off

Three problems inhalation teams are facing now.

Propellant switch 2030

The EU exemption for pMDI propellants shrinks from 2027 and ends in 2030. 44% of pMDIs sold have no declared low-GWP plan.

Compare regional deposition of your current and new-propellant formulations from your own APSD data, before you commit to bridging studies.

Source: Inhalation, Dec 2025
Generic inhalers $45M

Industry estimate for a single clinical-endpoint bioequivalence study with more than 900 patients.

Regional deposition evidence to support an in vitro and modelling route, in line with FDA's work on model master files.

Source: ONdrugDelivery (Nanopharm), 2020
Real patients 82%

of hospitalised COPD patients misused at least one inhaler, including breaths too weak for the device.

Test weak, typical and strong inhalation flow rates in different airway geometries without recruiting a single patient.

Source: Grandmaison et al., Chronic Obstr Pulm Dis, 2024
Where we fit

Answer early questions on the cheapest step.

Simulation does not replace your clinical programme. It tells you which formulation, device or breathing condition deserves the expensive steps, and gives reviewers a mechanism behind your data.

  1. In silico CFDdays · no subjects
  2. In vitro, realistic throatlab rig · weeks
  3. Gamma scintigraphytens of volunteers · radiolabel
  4. Pharmacokinetic studyvolunteers · clinic
  5. Clinical endpoint study900+ patients · ≈$45M

Step heights indicate relative cost and effort, not exact figures.

Validation

Checked against experiment, line by line.

Before we model your device, the solver is tested on the ERCOFTAC realistic-airway benchmark, where PIV measurements and published LES are available.

Case
ERCOFTAC AC7 mouth-to-bronchi airway
Flow
60 L/min steady inhalation
Solver
GPU lattice Boltzmann, 0.5 mm lattice
Statistics
2 flow-through times, time-averaged
Compared
PIV and reference LES at six stations
PIV experiment SomnetX LBM 0.5 mm Reference LES

Mean in-plane velocity across each PIV line, normalised by the tracheal bulk velocity. Real simulation output, shown for all six stations without smoothing.

Technology

From scan to answer, hands-off.

You send the airway and the question. One automated pipeline does the rest.

Your CT and conditions Scan or STL, flow rate, particle size
SomnetX pipeline Segment · voxelise · simulate on GPU
Regional dose report Where the dose lands, region by region
No mesh

The airway is filled with cubes automatically. No days of manual mesh repair.

1 GPU

A full mouth-to-bronchi airway at 0.5 mm in about 7.4 hours, measured on our own run.

×6

Two flow rates by three particle sizes, the scope of one pilot, run as a single batch.

On the roadmap automatic CT segmentation (today we start from your STL or a segmented scan) · breathing-cycle inflow · nasal and upper airways, including sleep-disordered breathing

How a pilot runs

From your inputs to a regional dose report.

Scope

We agree the device flow profile, particle size distribution and the questions the report must answer.

→ one-page case definition

Geometry

A validated reference airway, or your CT-derived airway after surface checks and region labelling.

→ labelled airway model

Simulate

Airflow to statistical steady state, then particle injection across your size bins on GPU.

→ flow and particle data

Report

Regional deposition tables, flow visualisations and a methods note you can share internally.

→ PDF report and data files
Inhalation CFD Regional Deposition Pilot
US$1,500–3,500fixed fee

A first, bounded study to test whether simulation answers your question. Price depends on the number of flow rates, particle sizes and whether we use your airway geometry.

  • Up to 2 inhalation flow rates
  • Up to 3 particle sizes or one distribution
  • Reference or customer airway
  • Regional deposition by segment
  • Flow and particle visualisations
  • Review call with the engineers
Built for

Teams who need regional numbers, not a total.

  • Inhaler device developersDPI · pMDI · SMI
  • Generic inhaler developersbioequivalence support
  • Formulation teamsMMAD · GSD · propellant
  • Nebulizer and spacer designersdroplet size · flow
  • CROs and academic groupsmethod support
Contact

Tell us about your product.

Send the device type, target flow rate and particle size. We reply within two working days with a scope and a fixed quote.

hello@somnetx.com